Curve date: 07-02-2026 - Source: FRED DGS constant-maturity series
A spread is the difference between two Treasury rates, calculated as first maturity minus second maturity. Positive means the first rate listed is higher; negative means the second is higher.
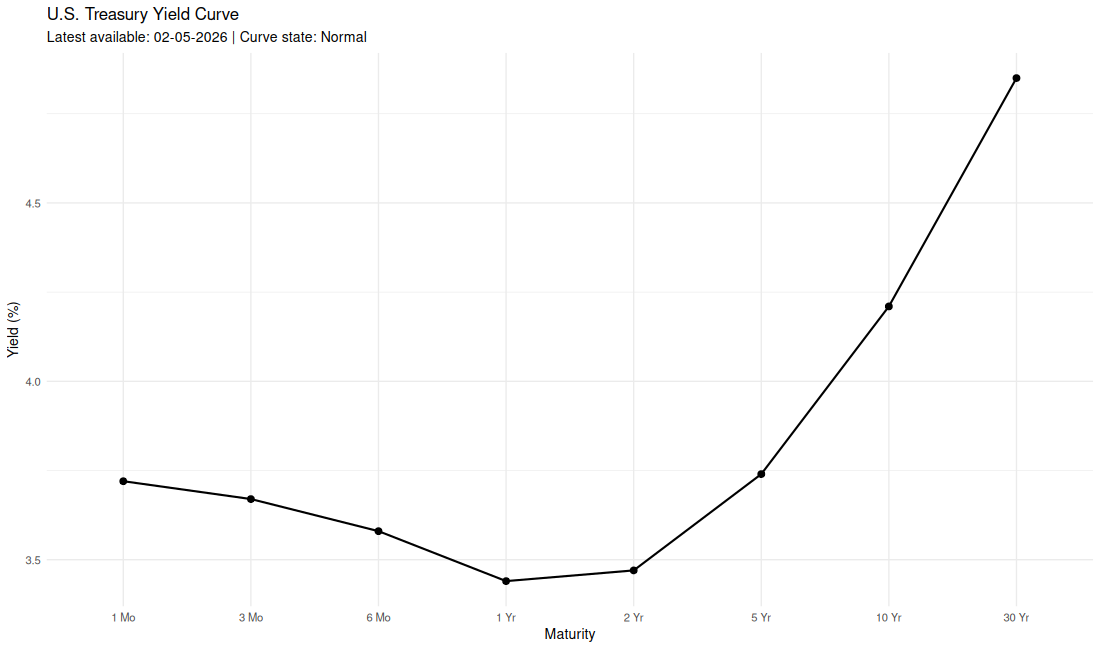
| Maturity | Yield (%) |
|---|---|
| 1 Mo | 3.70 |
| 3 Mo | 3.82 |
| 6 Mo | 3.98 |
| 1 Yr | 3.96 |
| 2 Yr | 4.14 |
| 5 Yr | 4.23 |
| 10 Yr | 4.49 |
| 30 Yr | 4.98 |
This table compares today's Treasury rates and key spreads with approximately 30 days ago, 90 days ago, and one year ago. It helps show whether deposit-rate pressure is rising, falling, or mostly unchanged.
| Metric | Today | 30D Ago | 90D Ago | 1Y Ago | Change vs 30D | Change vs 90D | Change vs 1Y |
|---|---|---|---|---|---|---|---|
| 1 Mo | 3.70% | 3.72% | 3.71% | 4.33% | -0.02% | -0.01% | -0.63% |
| 3 Mo | 3.82% | 3.77% | 3.71% | 4.41% | +0.05% | +0.11% | -0.59% |
| 6 Mo | 3.98% | 3.78% | 3.73% | 4.28% | +0.20% | +0.25% | -0.30% |
| 1 Yr | 3.96% | 3.82% | 3.72% | 3.99% | +0.14% | +0.24% | -0.03% |
| 2 Yr | 4.14% | 4.05% | 3.84% | 3.78% | +0.09% | +0.30% | +0.36% |
| 5 Yr | 4.23% | 4.17% | 3.99% | 3.87% | +0.06% | +0.24% | +0.36% |
| 10 Yr | 4.49% | 4.46% | 4.35% | 4.30% | +0.03% | +0.14% | +0.19% |
| 30 Yr | 4.98% | 4.97% | 4.91% | 4.82% | +0.01% | +0.07% | +0.16% |
| 10Y-3M Spread | 0.67% | 0.69% | 0.64% | -0.11% | -0.02% | +0.03% | +0.78% |
| 10Y-2Y Spread | 0.35% | 0.41% | 0.51% | 0.52% | -0.06% | -0.16% | -0.17% |
| 30Y-10Y Spread | 0.49% | 0.51% | 0.56% | 0.52% | -0.02% | -0.07% | -0.03% |
| 1M-3M Spread | -0.12% | -0.05% | 0.00% | -0.08% | -0.07% | -0.12% | -0.04% |
PCE is the inflation measure tied to the Fed's 2% target. This section shows the latest PCE reading available in FRED and whether inflation is moving closer to or farther from that target.
| Metric | Latest | Read |
|---|---|---|
| PCE YoY | 4.07% (month: May 2026) | Above target; Fed may stay cautious |
| PCE 3M annualized | 6.28% | Inflation has been running hot recently |
How to read this: YoY shows how much prices have increased over the past year. The 3M annualized number shows the recent pace of inflation by taking the last three months and converting that pace into a yearly rate. For deposit strategy, higher PCE can keep short-term rates sticky, while cooling PCE can support lower rate expectations.
This page updates to the latest business day available in FRED. Weekends and holidays will show the prior business day.
Curve state is based on the difference between the 10 Yr and 3 Mo Treasury yields. A +/-0.25 percentage-point range is treated as flat to reduce noise from small daily moves.
Maintained by Dylan Lynch | LinkedIn